Gen Z Civic Engagement and Voting Data
Webpage Purpose:
This resource helps students, researchers, teachers, and anyone interested in Gen Z's political participation data. By using voter registration data, national voting statistics, and youth survey research, users can investigate patterns in Gen Z's political participation and explore possible reasons behind the gap between political interest and political action. These inisghts can then be used to drive actionable change to engage the youth.
What does the data look like?
Gen Z civic engagement data includes information about voter registration, voter turnout, political attitudes, issue priorities, barriers to political participation, and more. The resources below showcase different types of data. Some show what Gen Z's actionas are, while others capture the data about their aspirations and reasons for engagement. This data helps to explain that there is a lack of participation, and allows for analysees into the demographics of people who are/ aren't politically active and why. These insights can be used for marketing, campaigning, funding, and other activities to increase political engagement.
Source 1
The Civics Center provides voter registration data about younger generations.
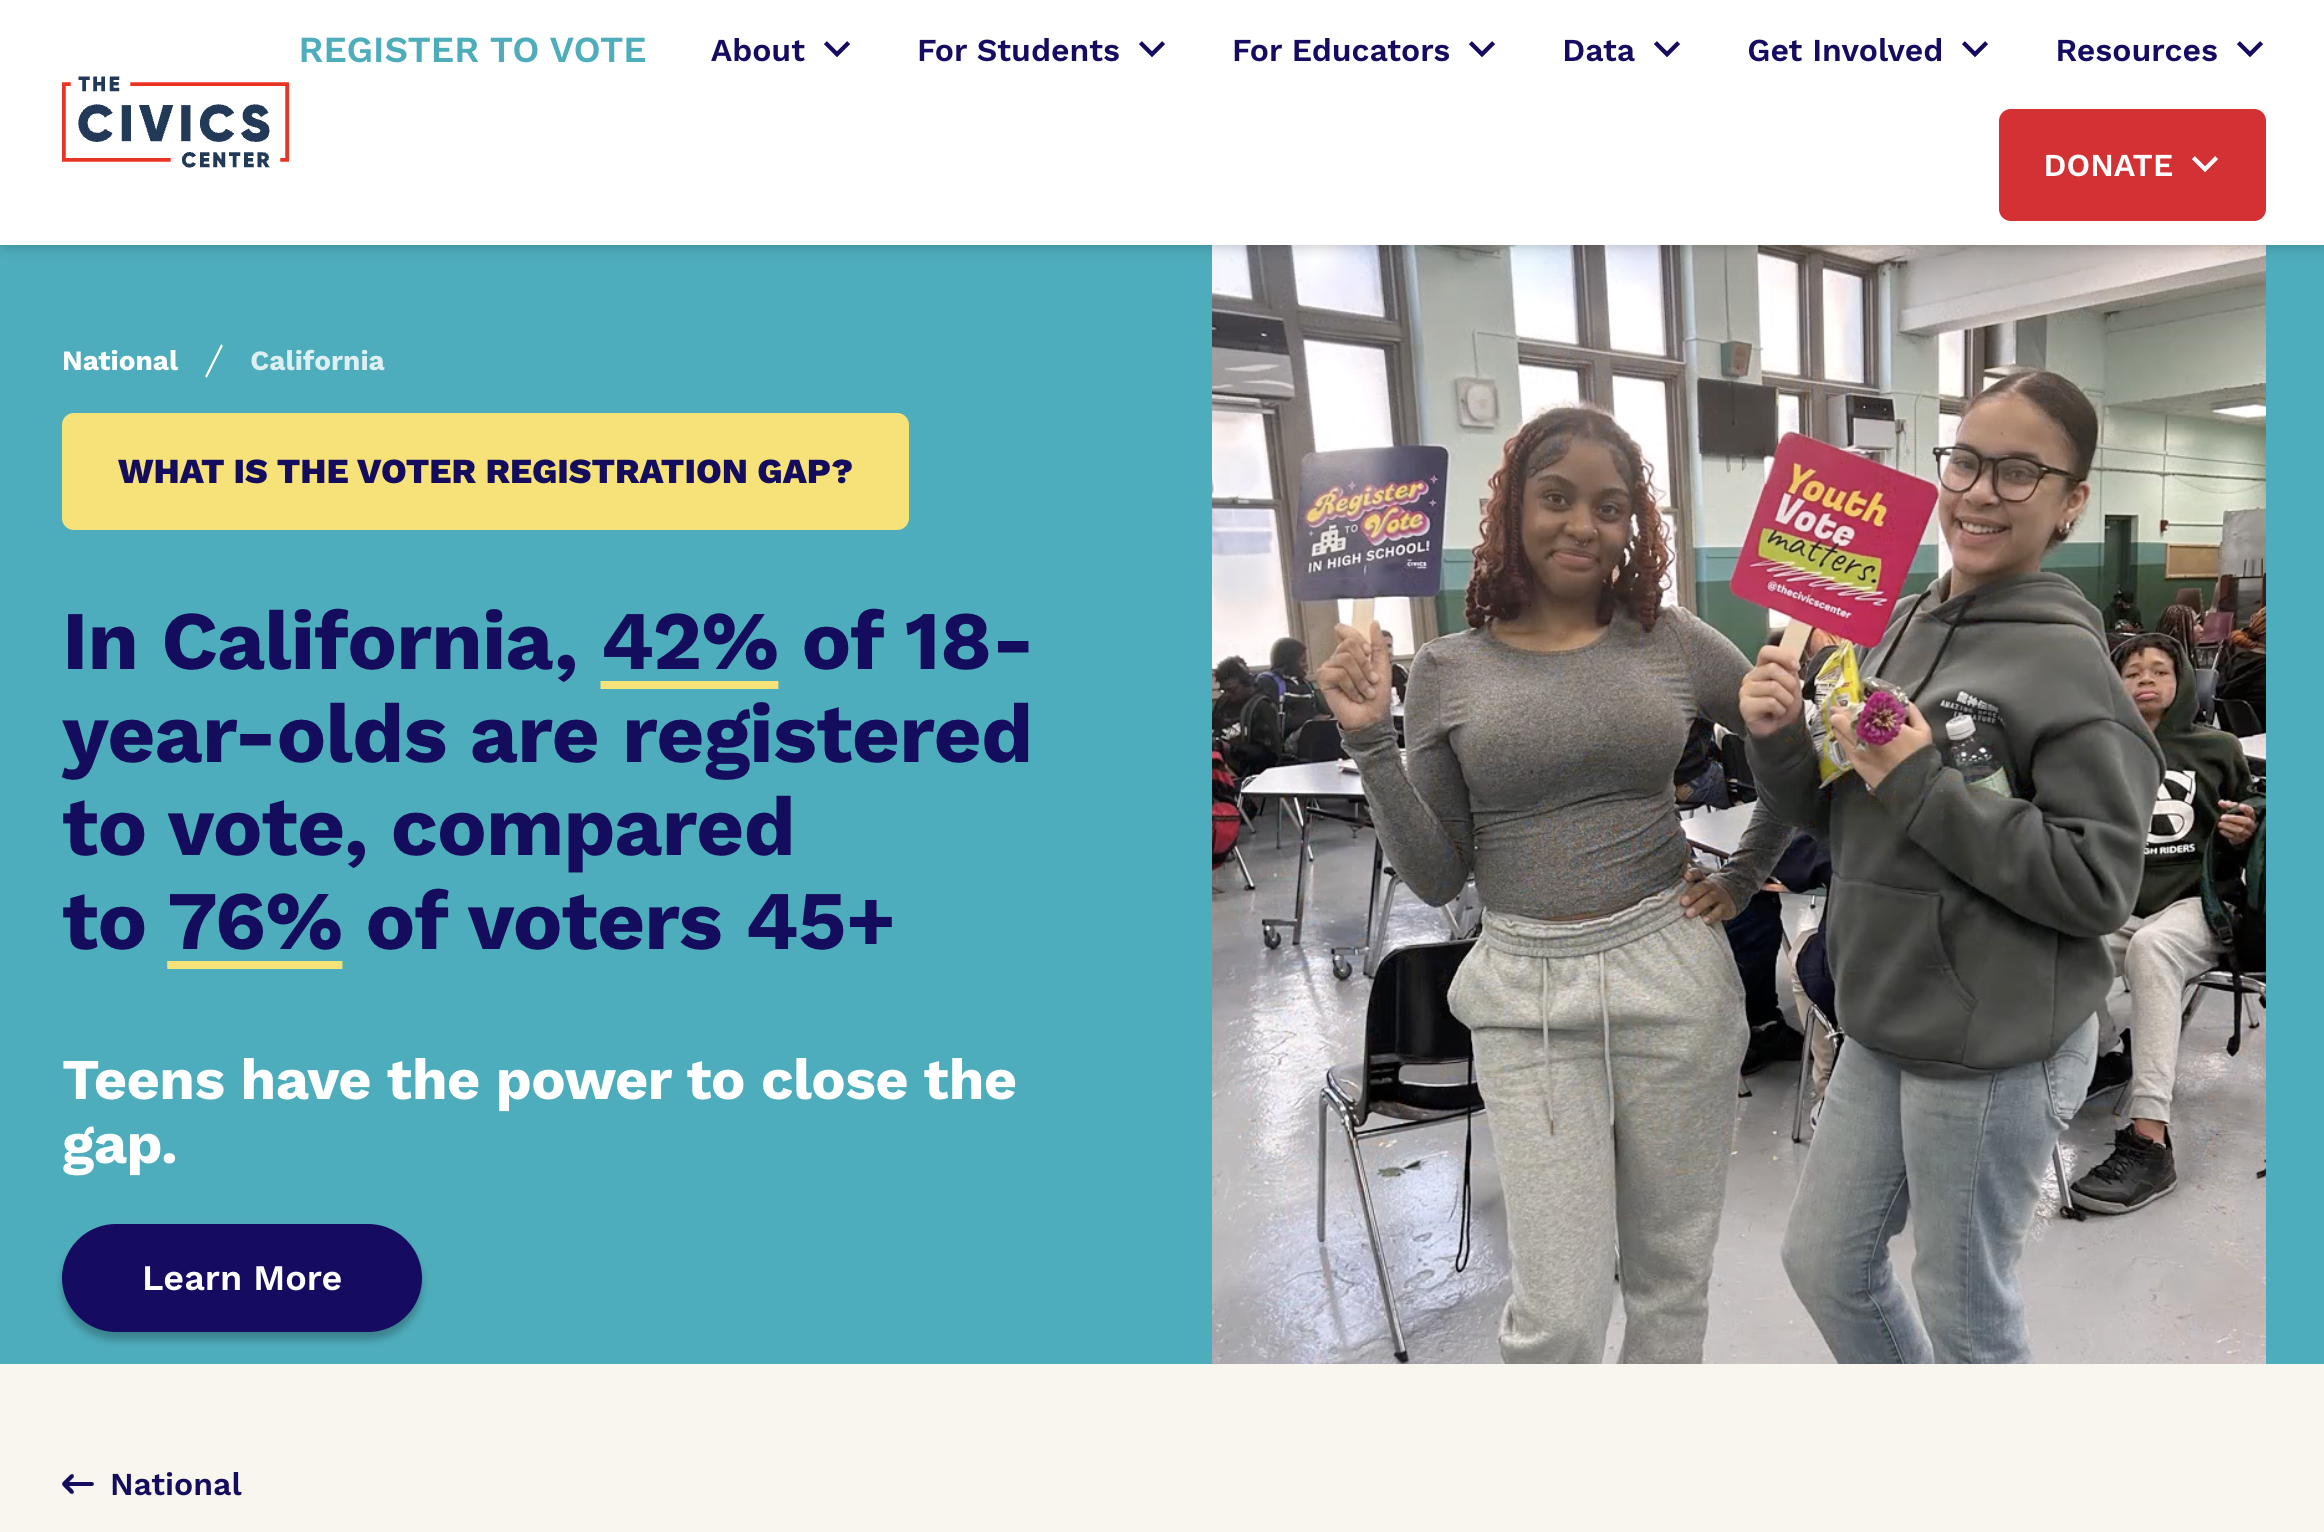
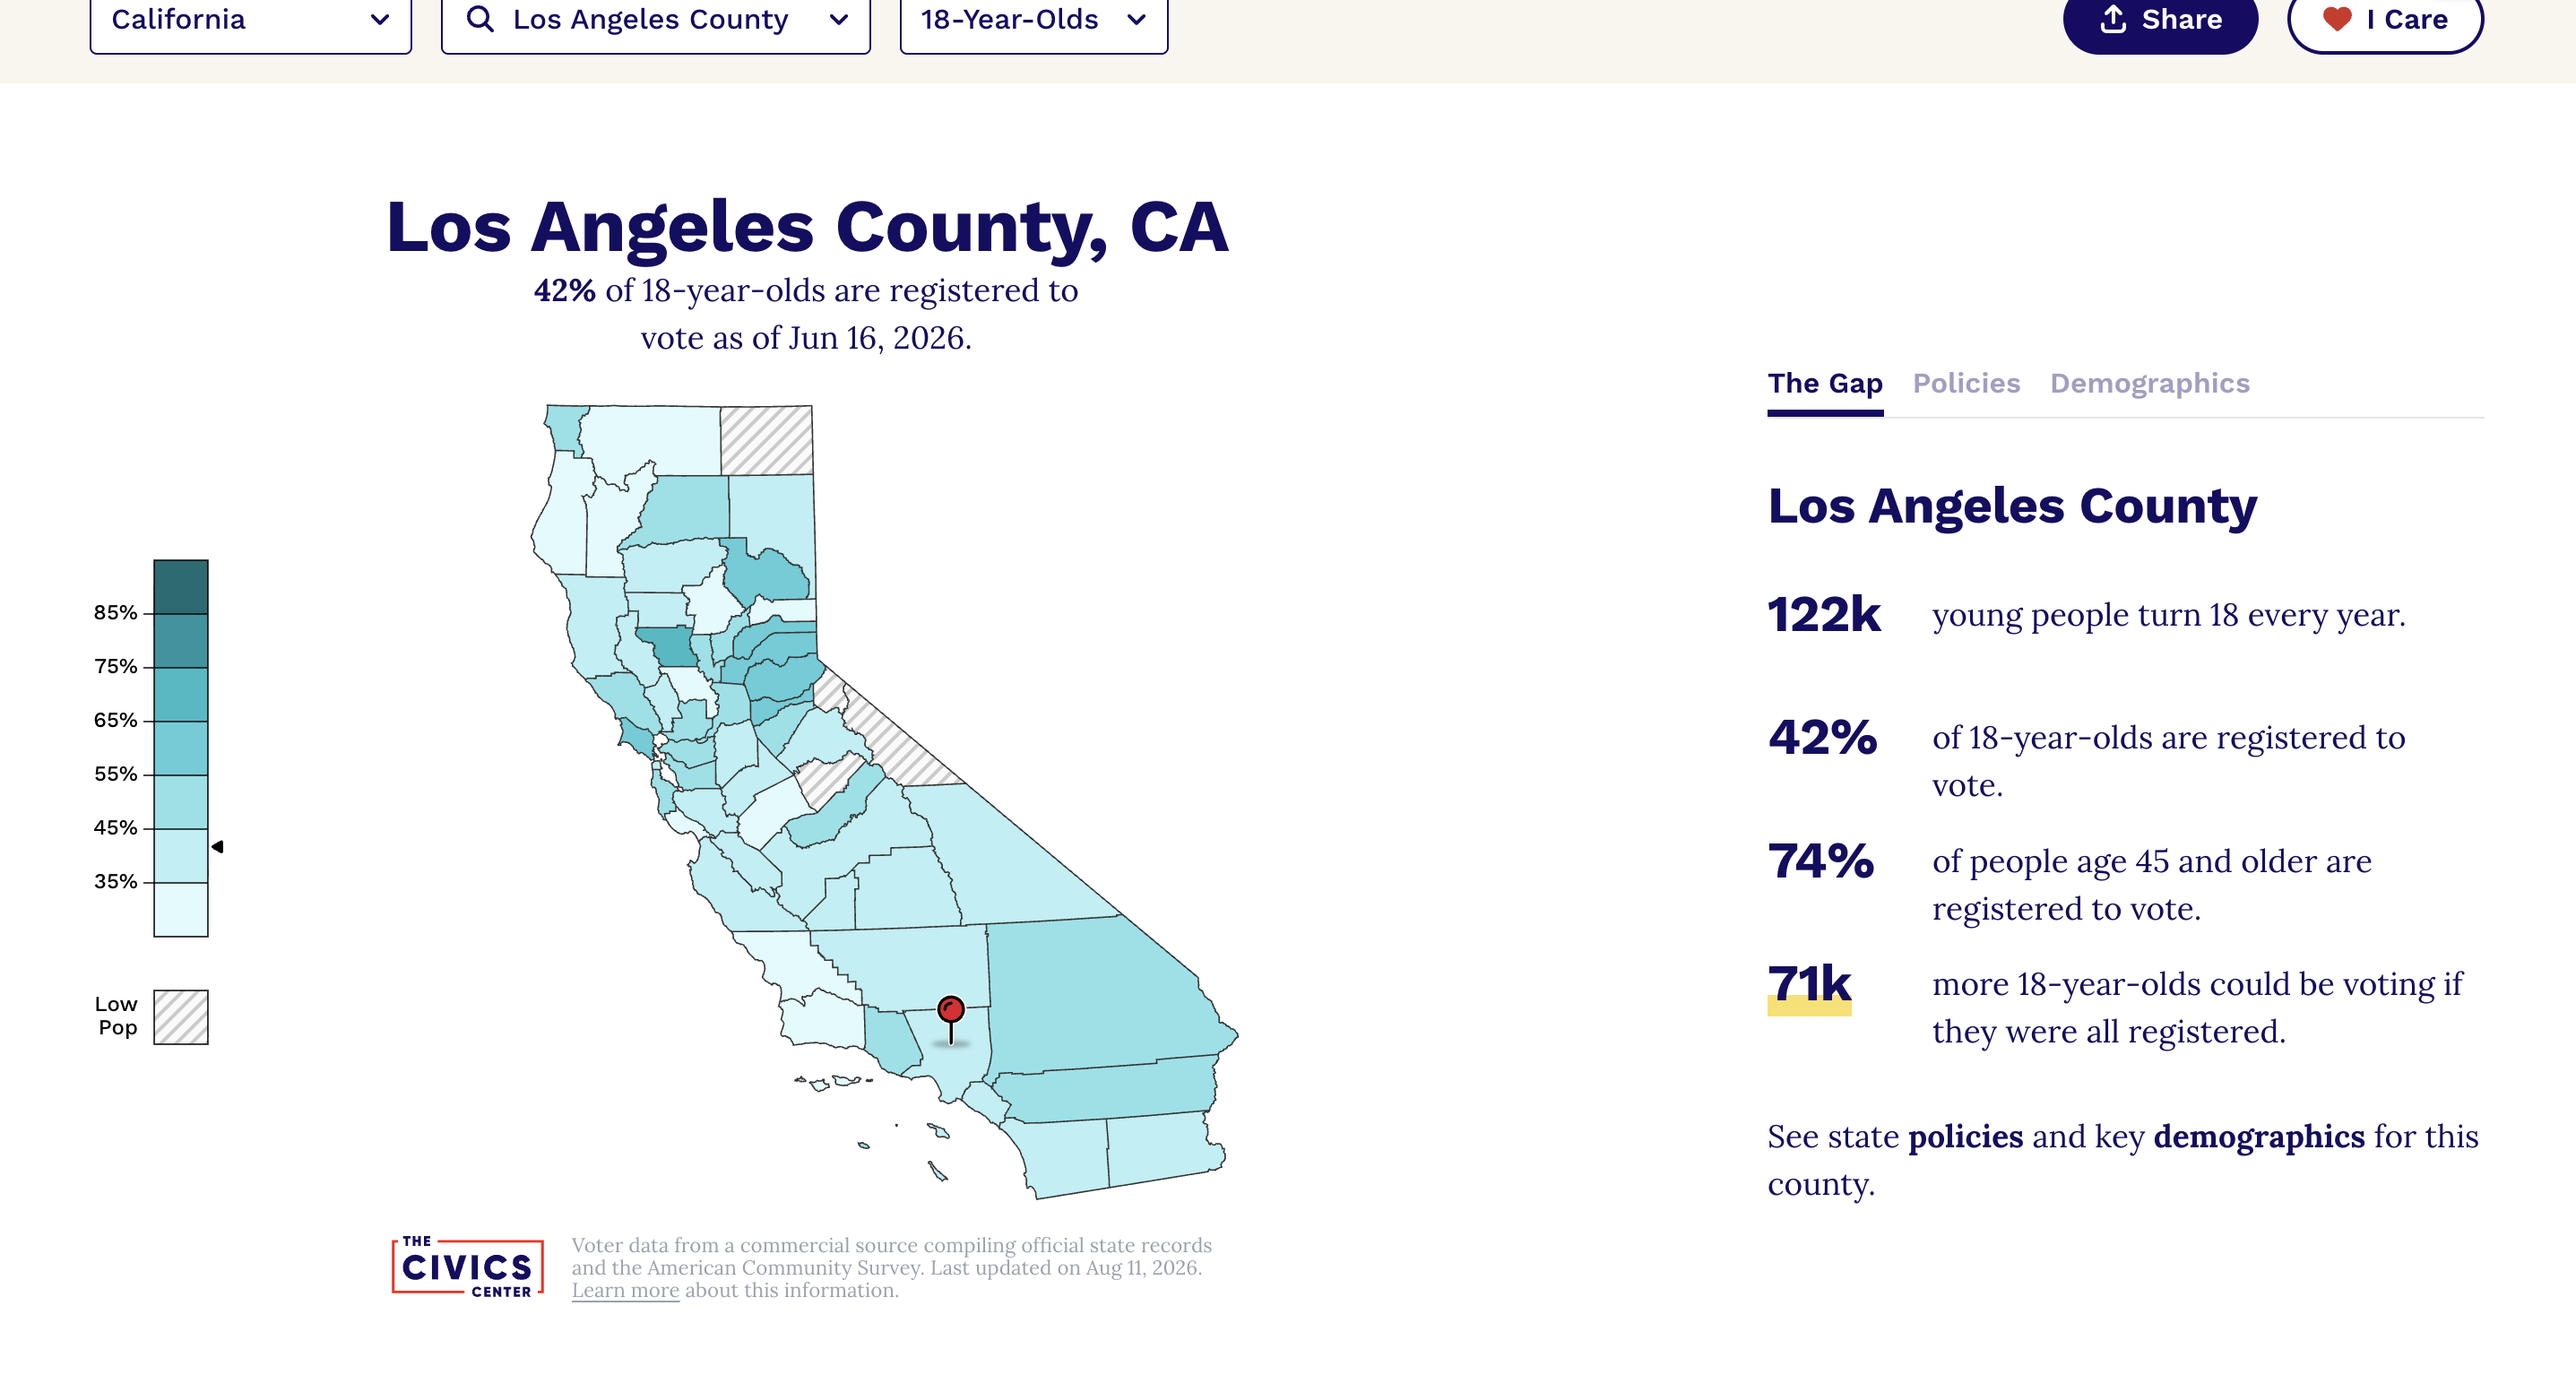
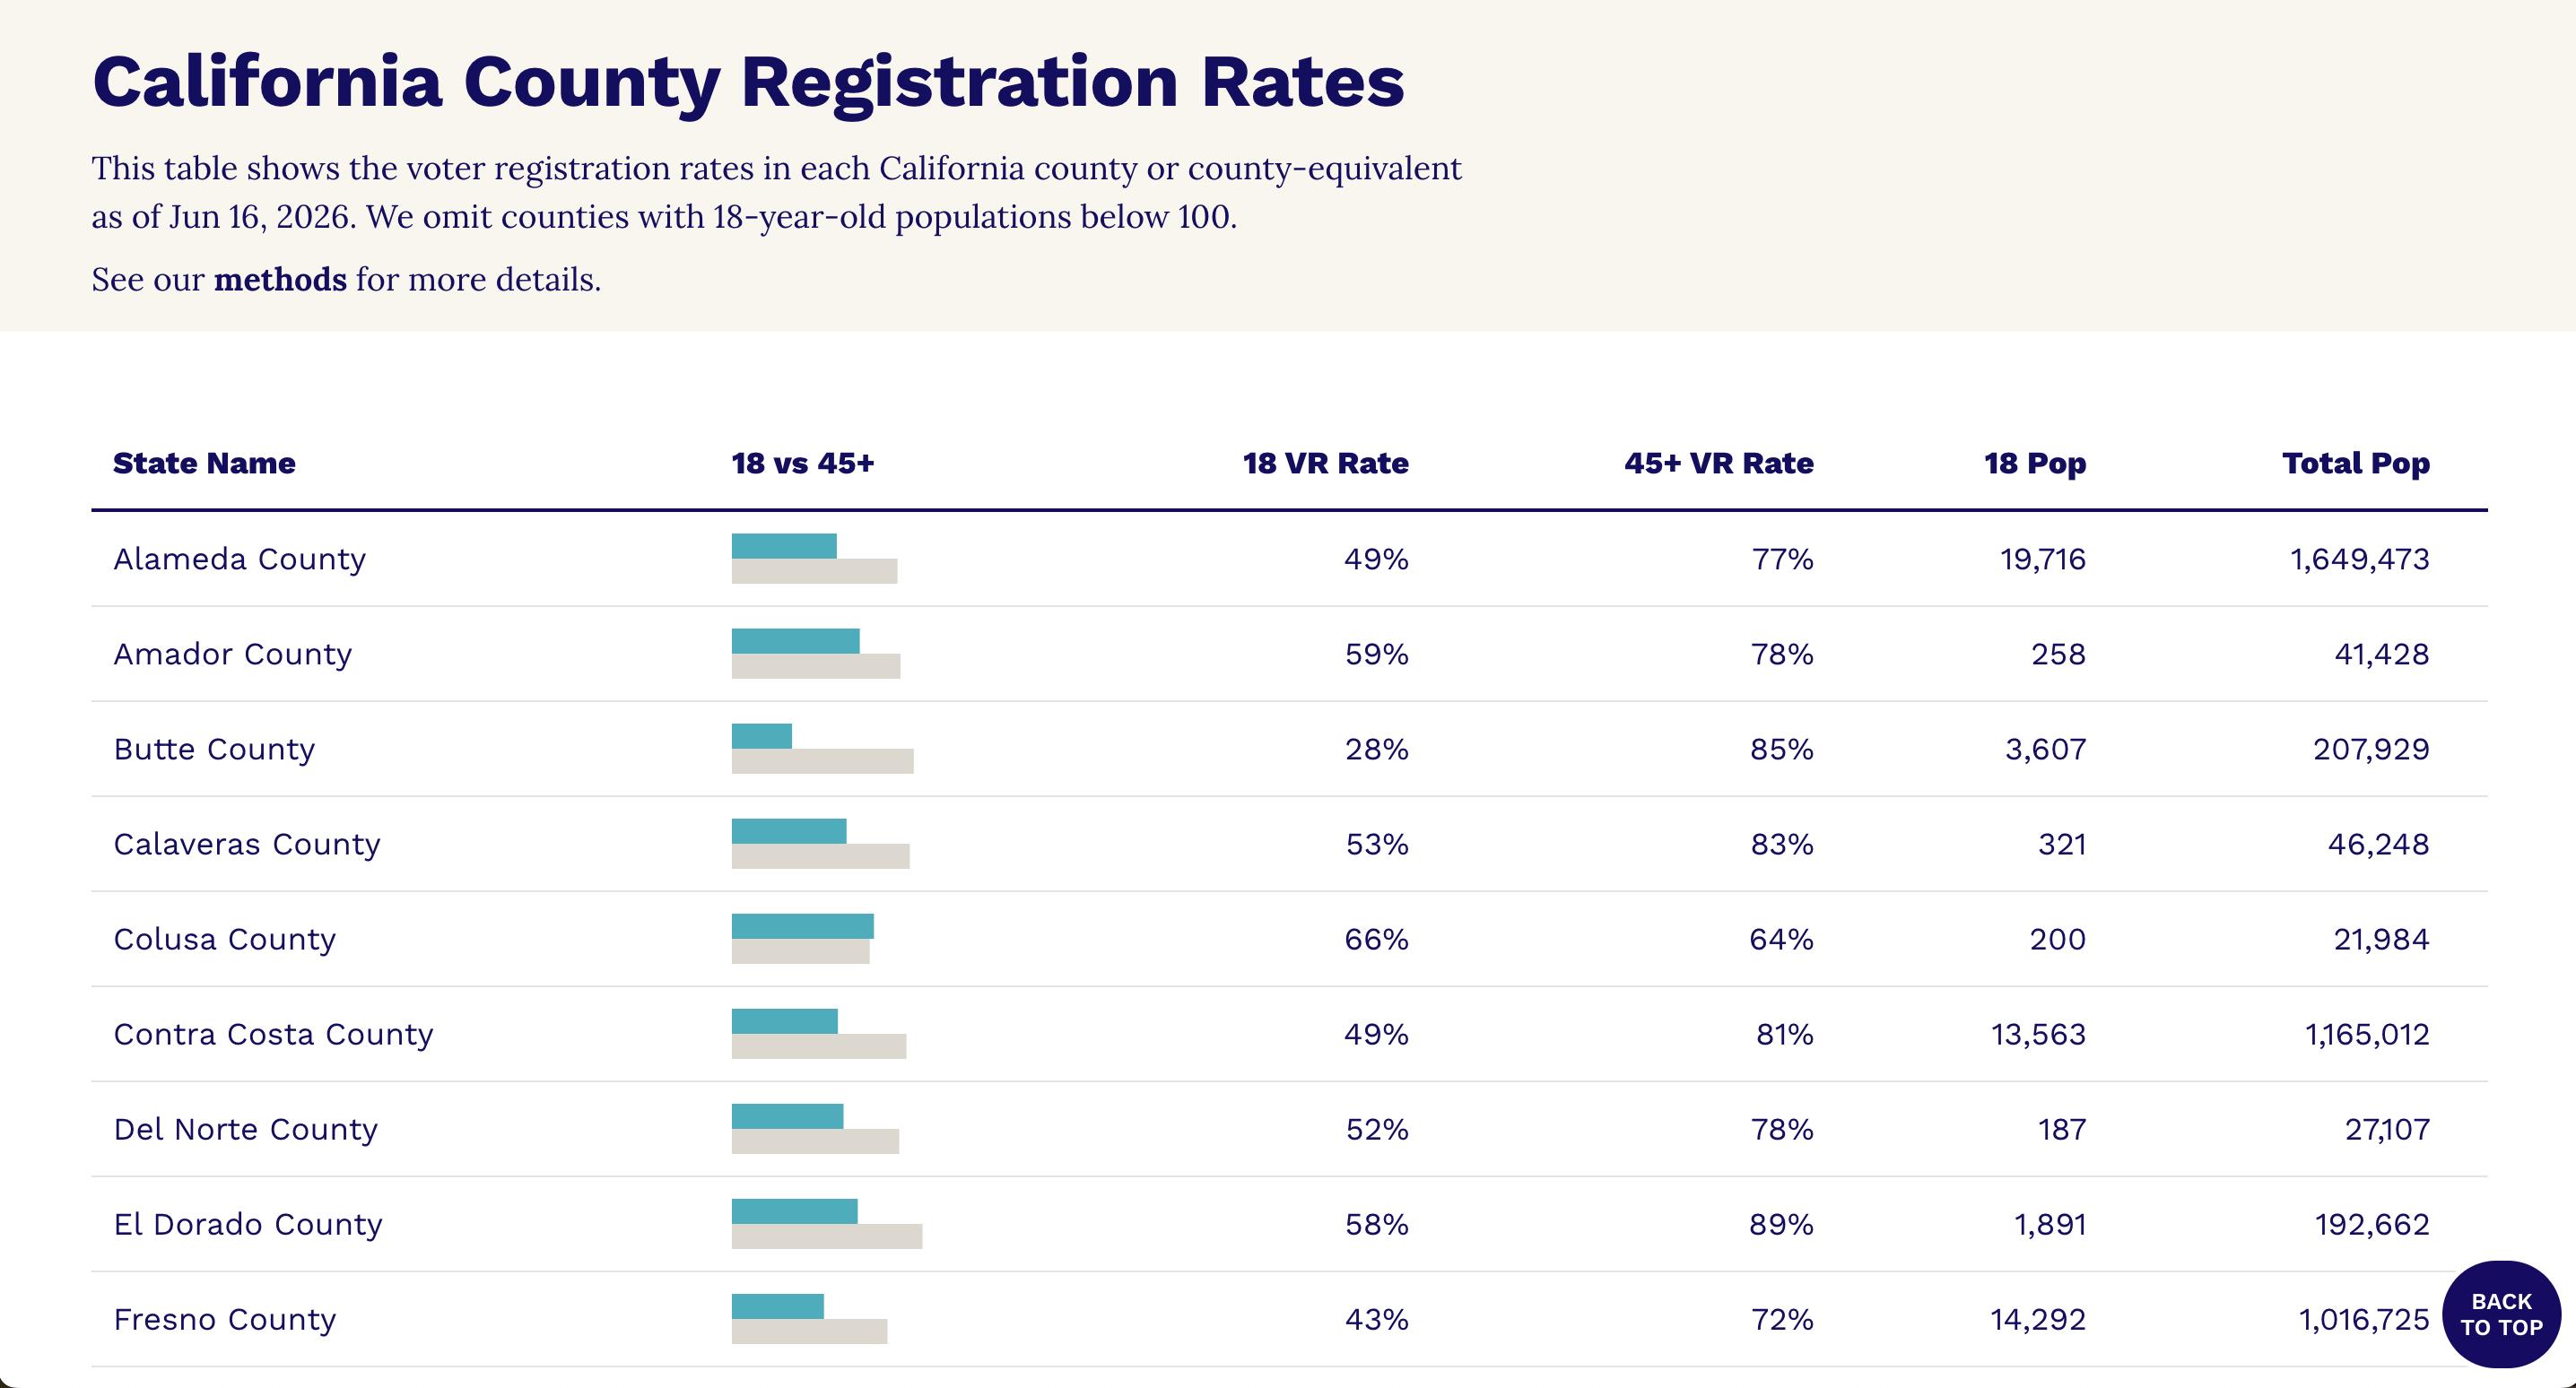
California voter registration rates for 18-year-olds compared with voters ages 45+. Source: The Civics Center.
The Civics Center's California data portal allows users to examine registration rates for 18-year-olds compared to adults ages 45 and older. The current Los Angeles data shows that 42% of 18-year-olds are registered to vote compared to 76% of voters ages 45+. A researcher can compare the voting rates of different counties rather than treating California as one uniform population. The table also includes the 18-year-old registration rate, 45+ registration rate, 18-year-old population, and total population.
Researchers would be able to use this data to analyze the gap in political engagement. For example, the data reveals a significant gap in Sierra County. While approximately four out of five residents ages 45+ are registered in both counties, only 14% of 18-year-olds are registered compared with 48% in Shasta County. However, one must also consider that Sierra County's population is significantly smaller than Shasta County's

Shasta County v. Sierra County Data
Source 2
The U.S. Census Bureau provides national data about voting and voter registration. The 2024 election tables examine voting and registration data.
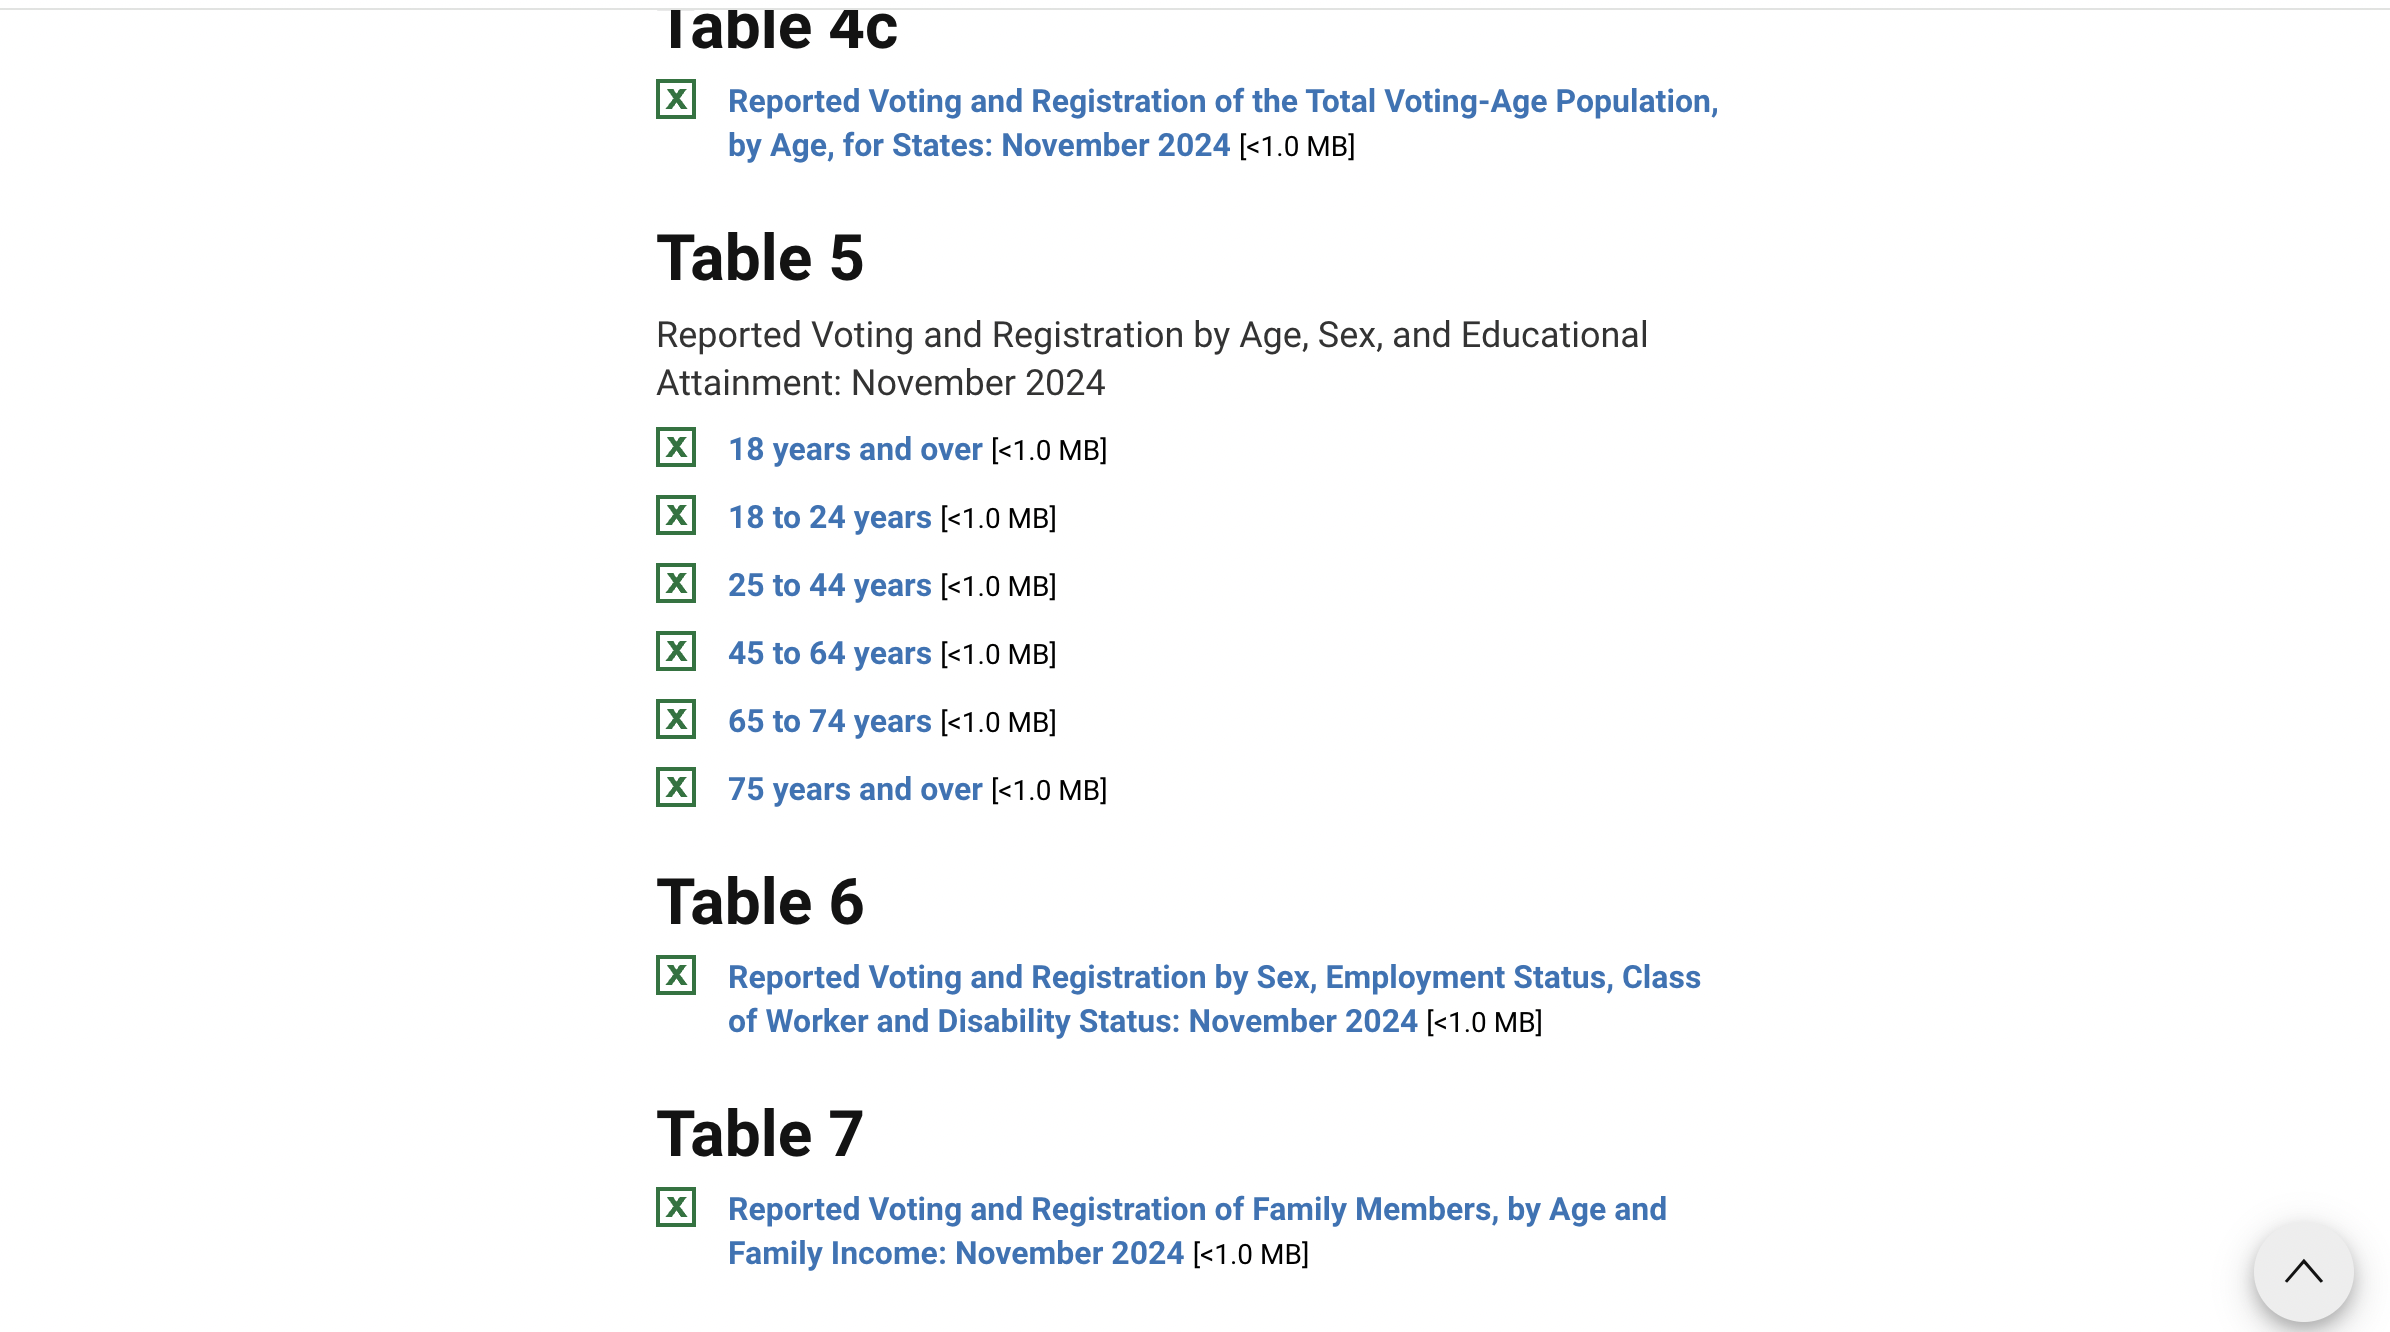
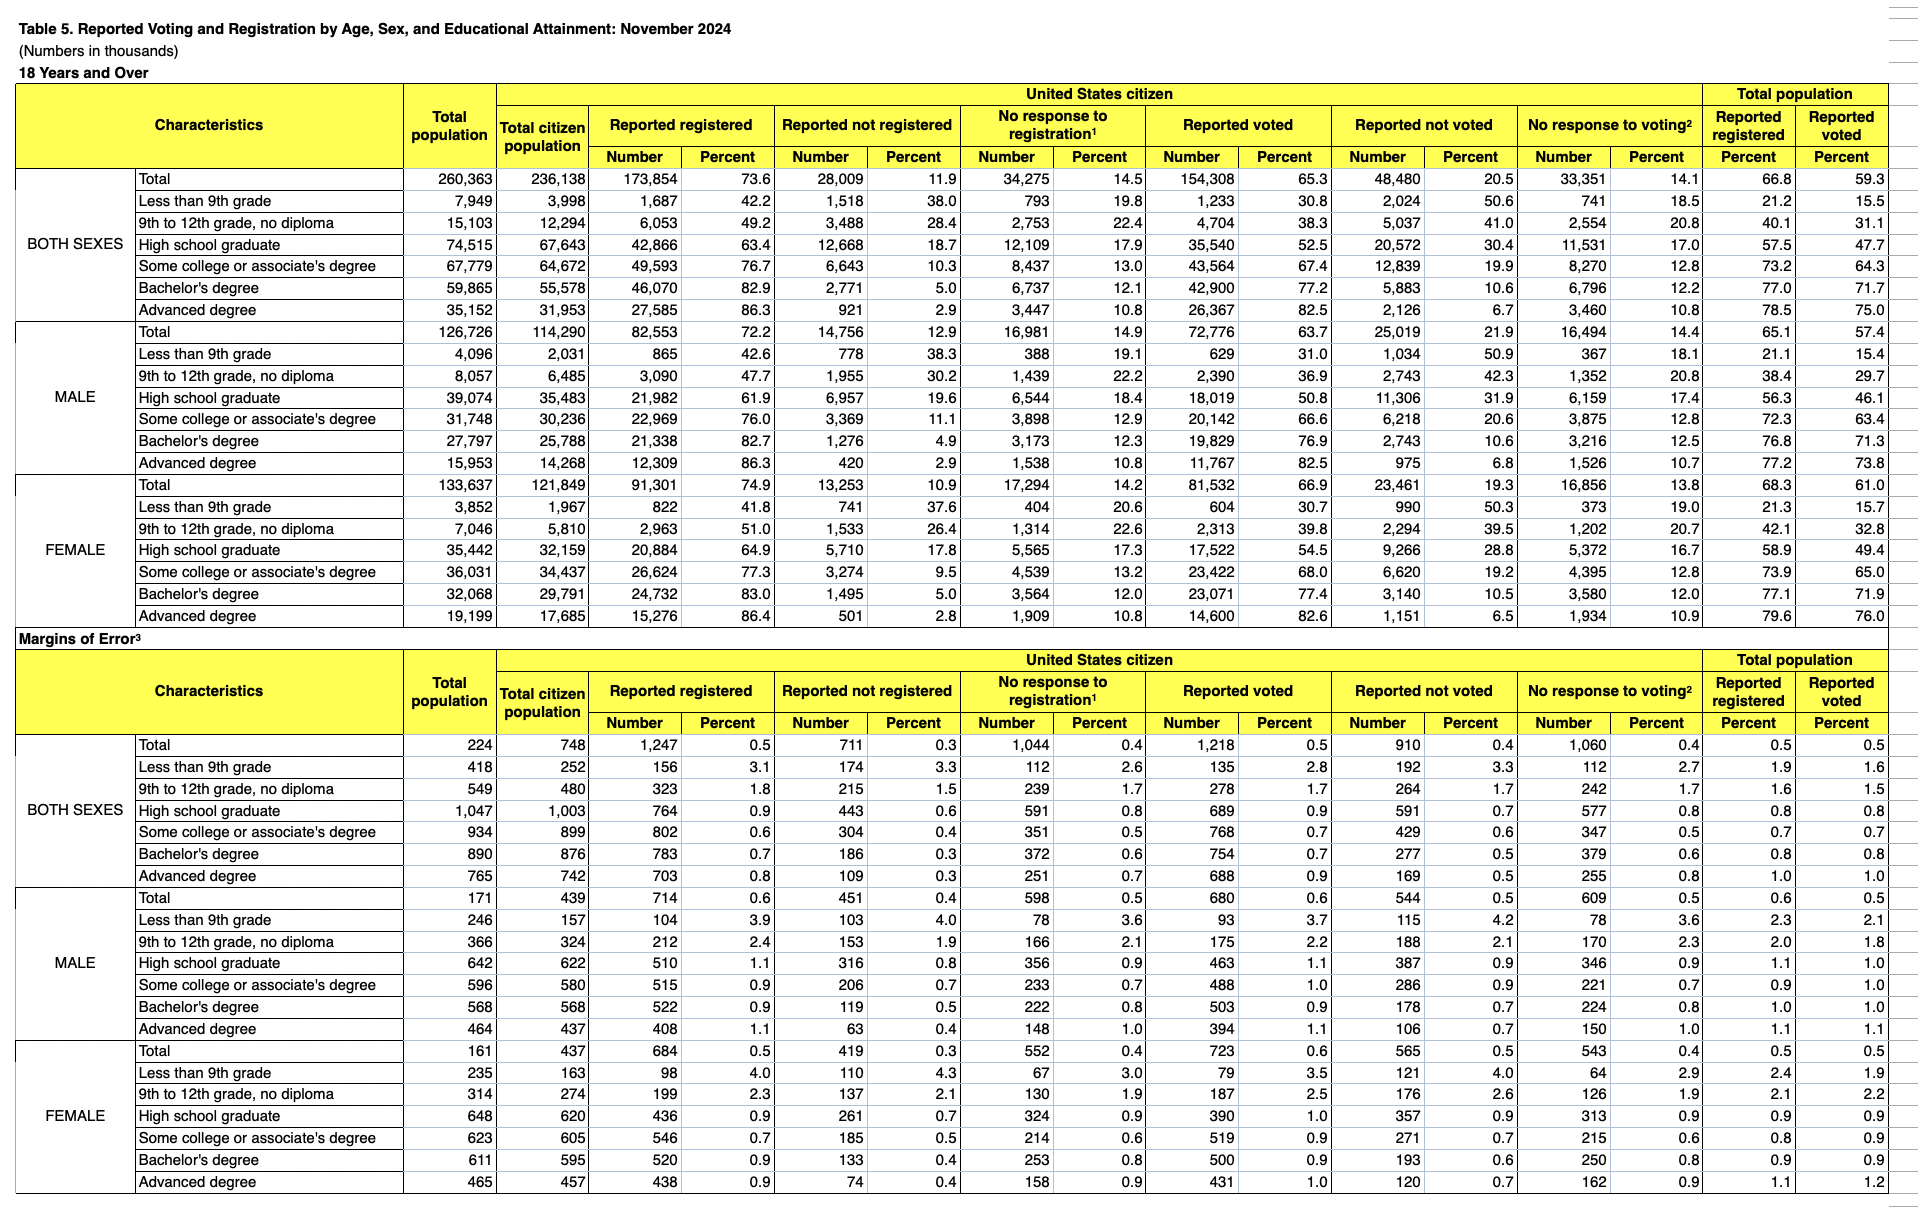
U.S. Census Bureau Table about Voting and Registration by Age, Sex, and Educational Attainment: November 2024
The Census data helps shift the comparison of voter activity from a local level to a national level. The Civics Center demonstrated differences between 18-year-olds and older voters in individual California counties. The Census Bureau can then help investigate whether age-related differences in registration and voting appear more broadly. The Census Bureau also provides a tables organized around specific differences, like age and educational attainment. making it possible to investigate whether participation differs across these groups.
Tables as such by the Bureau's allow us to ask broader questions, such as the ways registration might differ from actual voting and why, how Gen Z political participation differs between states, how age, education, and politics interact, and more. This Bureau's data is useful for contextualizing patterns found in more localized datasets.
Source 3

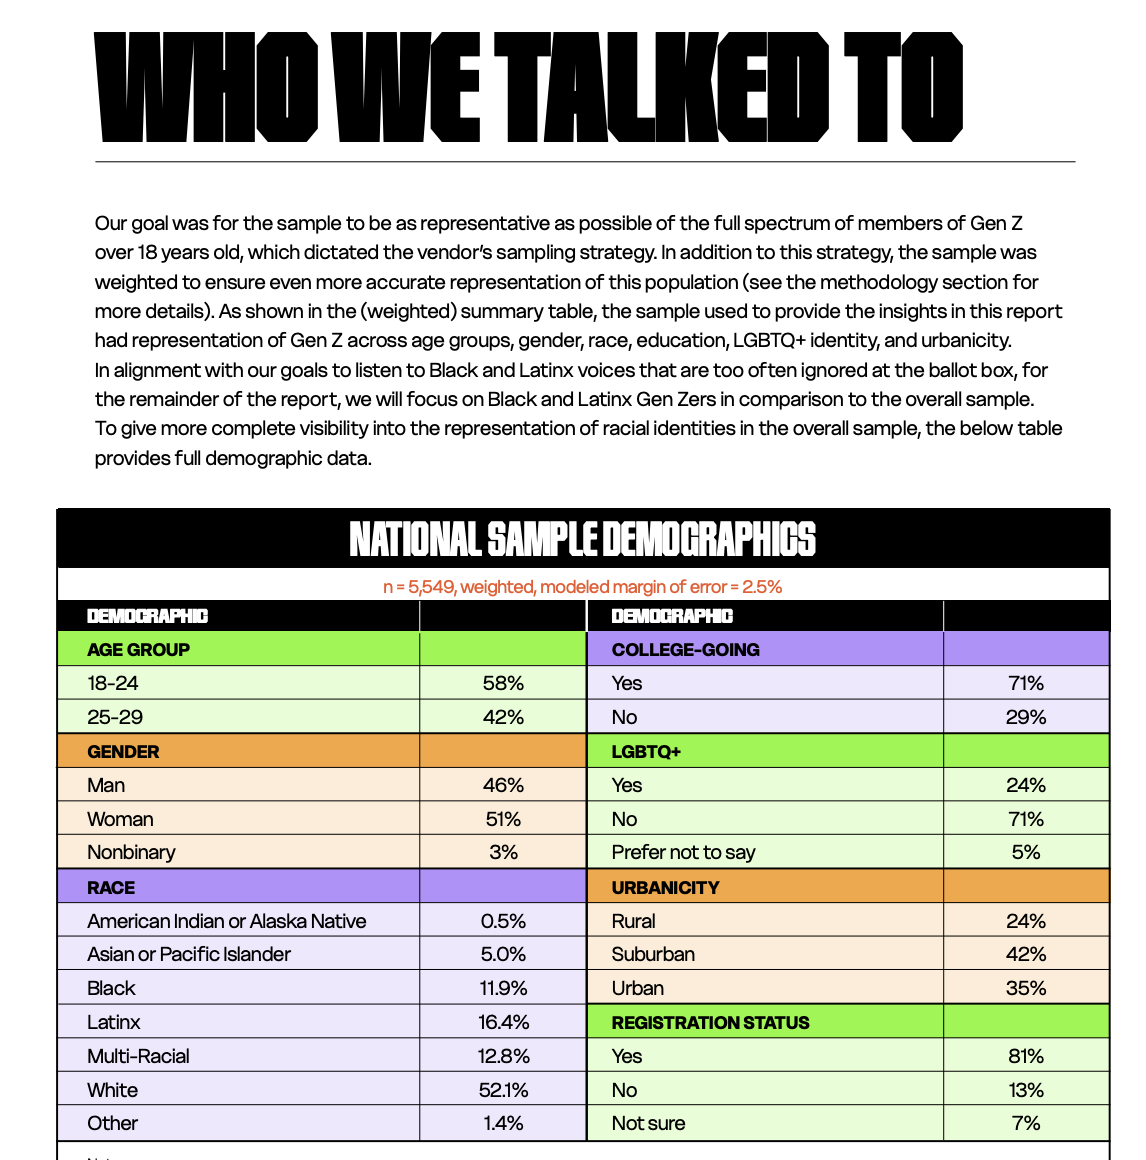
CIRCLE provides research and survey data that explais why or why not Gen Z is politically active. Its 2026 national survey included 5,549 people, ages 18-29, and examined political values, priorities, participation, and barriers.
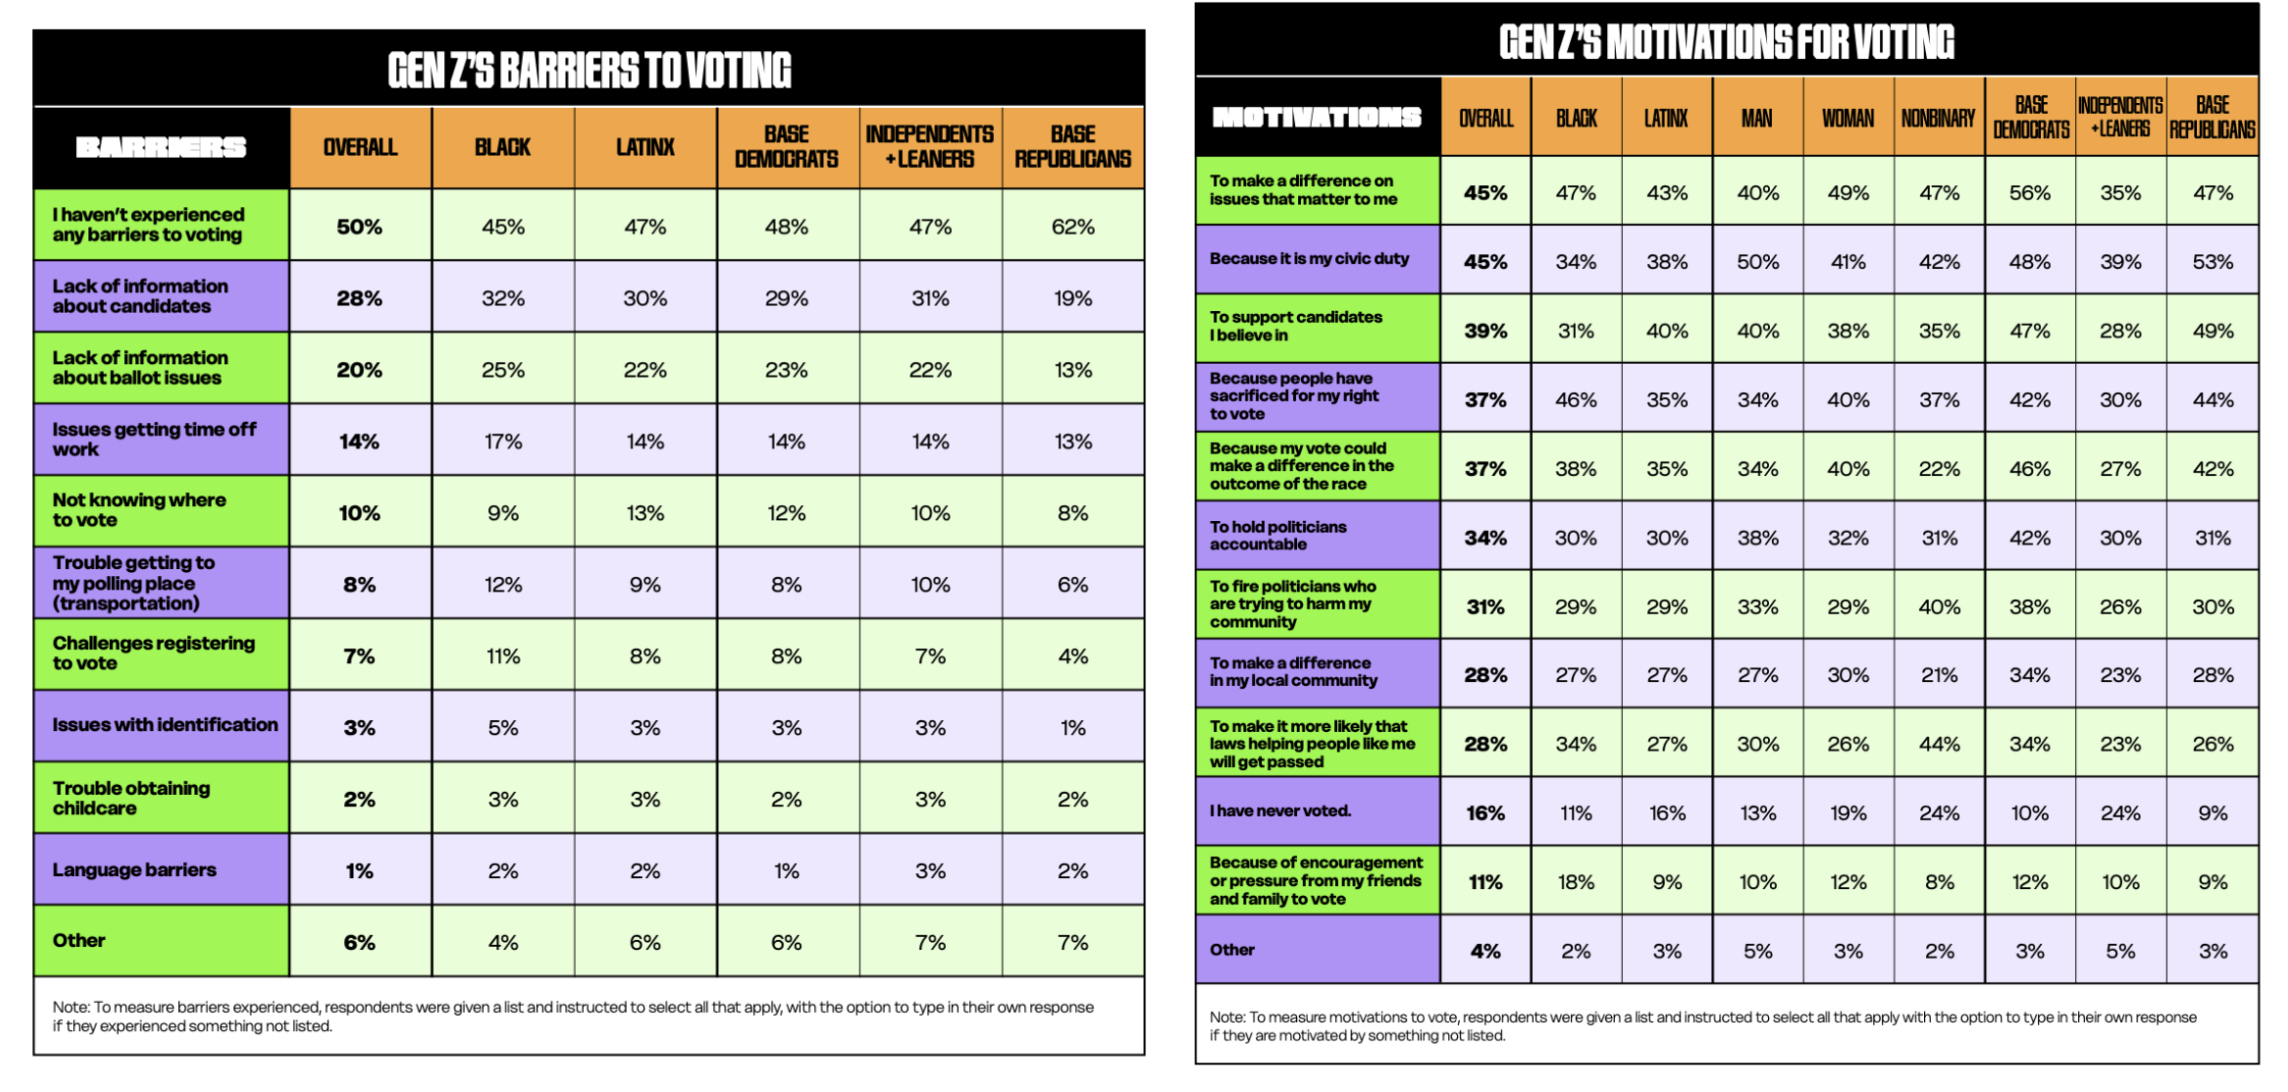
Gen Z Barriers and Motivations to Voting by Race
CIRCLE is especially useful because it provides information about attitudes and intentions, rather than only measuring whether someone registered or voted. For example, CIRCLE found that 89% of Gen Z surveyed reported being willing to vote, 88% were willing to talk to friends and family about issues they care about, and 78% would sign petitions. They were also able to identify access to information as a barrier. The research shows that 28% of respondents identified difficulty connecting their top issues to candidates as a barrier, while 20% identified difficulty understanding ballot choices.
CIRCLE's research demonstrates that low youth participation does not correlate to a low interest in politics. If 89% of surveyed Gen Z members report being willing to vote, but millions of eligible young people did not vote in 2024, there is a discreptancy in their willingness and actual behavior that can be solved through pattern identification. CIRCLE's findings suggest that information, political efficacy, and other barriers help explain this difference. Providing such data and insights can help politicians and advocates understand Gen Z's qualms so they can be fixed to increase political engagement.
What Can These Three Sources Tell Us About Gen Z Political Participation?
A researcher can use these sources to understand Gen Z's political activity and why it is the way it is. They can ask: What are young people actually doing? When does participation differ? Why might those differences exist?
Example
California voter registration rates for 18-year-olds vs voters ages 45+.
Step 1: Use The Civics Center to examine voter registration among young people. The data shows a clear age-related registration gap where 42% of Los Angeles's 18-year-olds are registered compared with 76% of voters ages 45 and older. While we've now identified the gap, we are unaware of why the gap might exist.
Step 2: Continue using the Civic Center to determine how much location is impacting the statistic. The table shows variation among counties. For example, Butte County has a 28% registration rate among 18-year-olds, while Colusa County has a 66% rate. This tells us that where a person lives matters because registration rates differ significantly between counties. Location, then, tells us that different communities have different characterizations impacting their activity.
U.S. Census Bureau Table about Voting and Registration by Age, Sex, and Educational Attainment: November 2024
Step 3: Use the US Census Bureau's data to find out what community characterizations impact political activity on a national level. The Census data allows researchers to compare voting and registration across age groups and demographic characteristics. It provides a broader dataset that can be used to determine whether similar age-related patterns appear nationally.
Step 4: Use the 2026 CIRCLE report to understand the reasonings behind differences in activity behavior. CIRCLE found that 89% of surveyed Gen Z respondents reported being willing to vote, while 88% were willing to discuss issues with friends and family and 78% were willing to sign petitions. Now, we know that there is a high willingness to participate despite having a low level of registration. Further analysis shows that Gen Z often experiences barriers including difficulty connecting their priorities to candidates and understanding ballot choices. This suggests that access to information may be one factor connecting political interest with political participation.
Gen Z Barriers and Motivations to Voting by Race 2026
Summarize: The Civics Center shows that young people have much lower voter registration rates than older voters and that registration varies geographically. The U.S. Census Bureau provides broader voting and registration data compared age and demographic groups nationally. CIRCLE adds information about Gen Z's attitudes, priorities, willingness to participate, and reported barriers. This shows that a large reason that Gen Z does not vote as much as other generations is because of the barriers they experience when trying to do so.