Three ways to read player performance
This dataset compares NHL players across scoring, shooting, and plus/minus. Looking at different statistics together reveals that high point totals do not always mean the same style of play or overall result.
01 / SCORING
Goals + Assists = Points
The ten highest point scorers are split into goals and assists to show how each player builds their total.
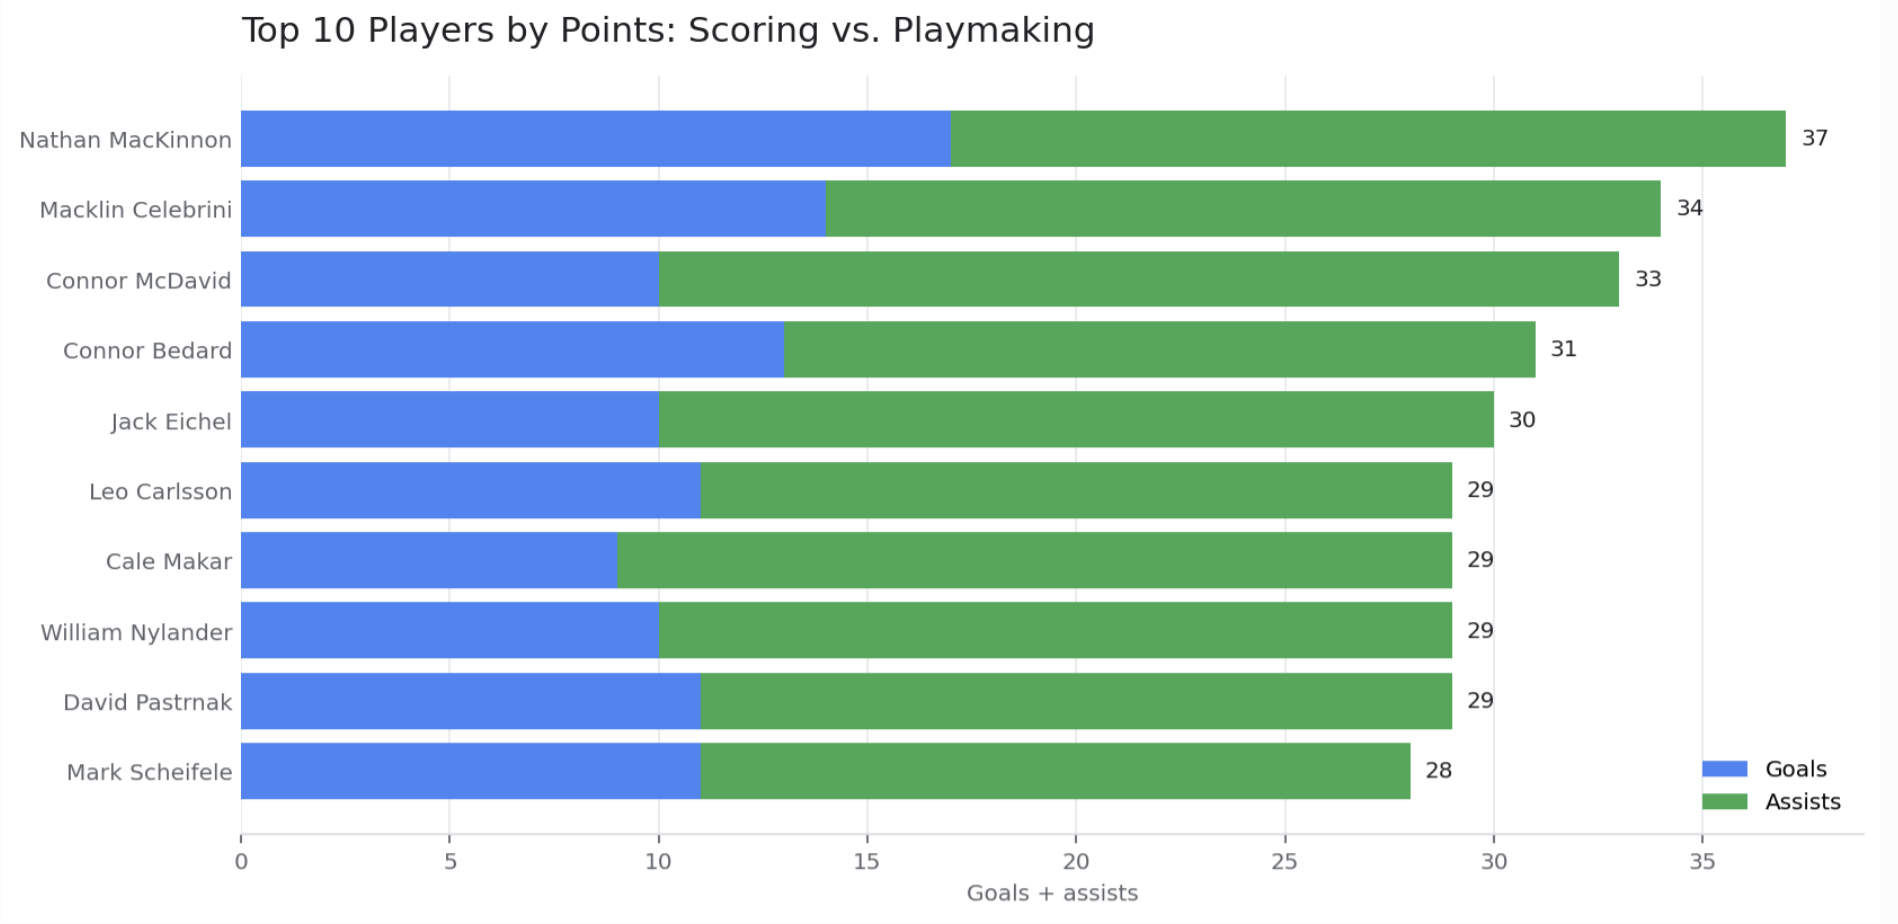
Nathan MacKinnon leads this group with 37 points. His 17 goals and 20 assists show a balanced contribution. The stacked bars make it easy to see that players can reach similar totals through different combinations of scoring and playmaking.
02 / SHOOTING
More Shots, More Accuracy?
Each dot represents one of the fifteen highest point scorers. The chart compares how often players shoot with how often those shots become goals.
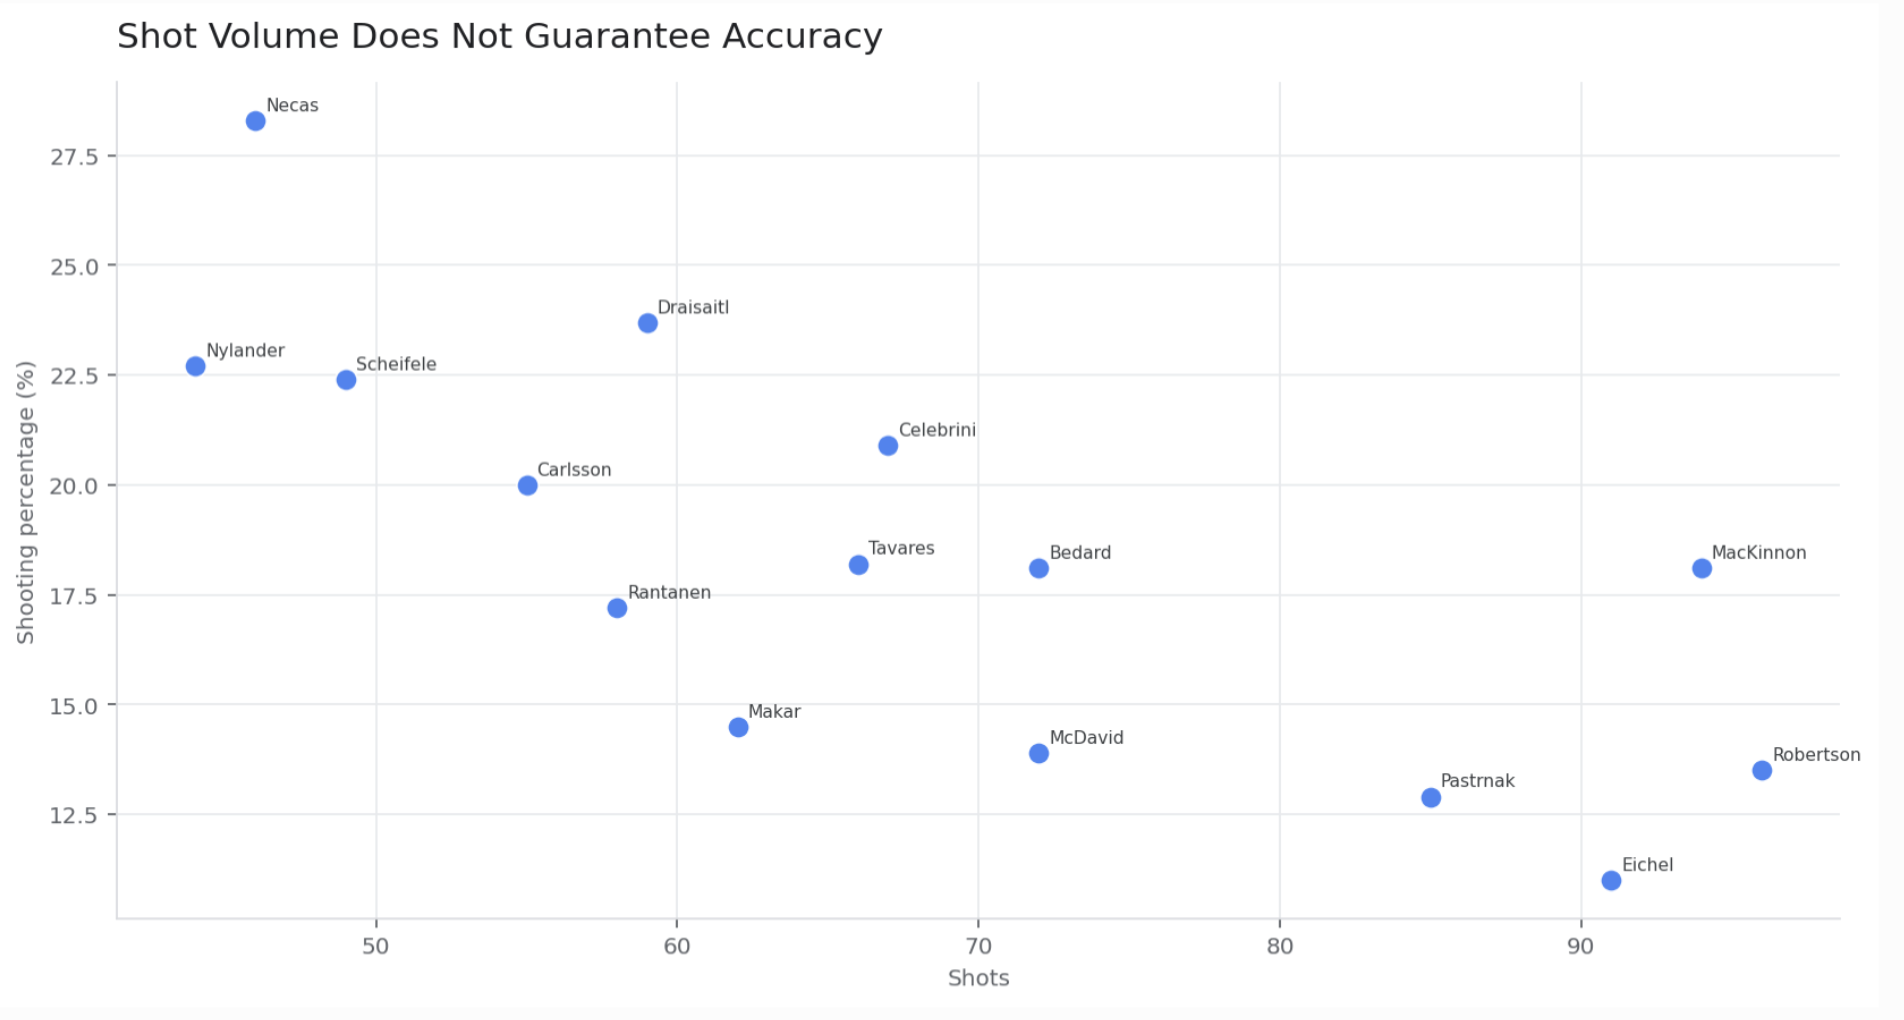
A high shot count does not automatically mean a high shooting percentage. The scatter plot displays both measures at once, making differences in shot volume and accuracy easy to spot.
03 / ON-ICE IMPACT
Points Do Not Tell the Whole Story
Plus/minus for the same fifteen top point scorers, with positive and negative values shown on opposite sides of the zero line.
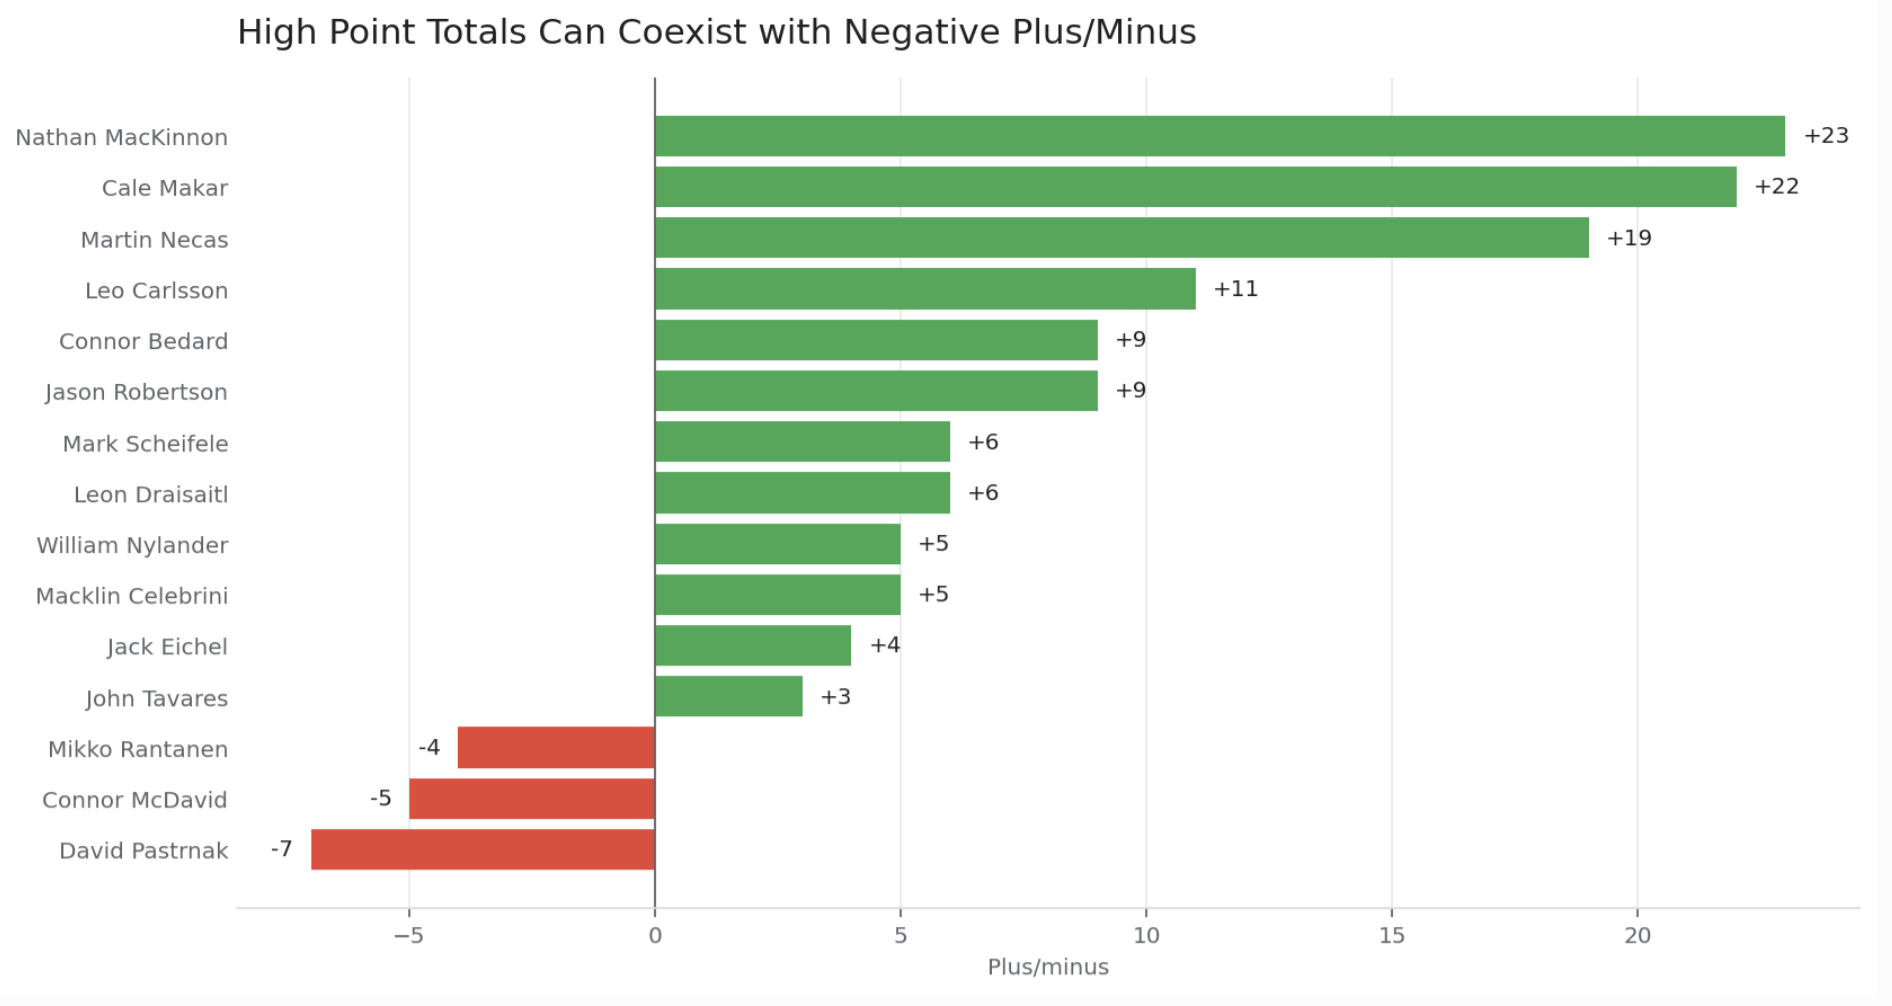
Connor McDavid has 33 points but a -5 plus/minus, while Nathan MacKinnon pairs the highest point total with +23. These differences show that offensive production and plus/minus describe different aspects of player performance.
SOURCE DATA
Original Dataset
The complete dataset is included below. Scroll horizontally to view all of the columns.
| Name | Team | Position | GamesPlayed | Goals | Assists | Points | PlusMinus | PenaltyMinutes | AvgTimeOnIce | PPGoals | PPAssists | Shots | ShootingPercentage | Shifts | GameWinningGoals | FaceoffWinPercentage |
|---|---|---|---|---|---|---|---|---|---|---|---|---|---|---|---|---|
| Nathan MacKinnon | COL | C | 22 | 17 | 20 | 37 | 23 | 12 | 21:44 | 5 | 4 | 94 | 18.1 | 511 | 2 | 48.5 |
| Macklin Celebrini | SJ | C | 23 | 14 | 20 | 34 | 5 | 12 | 20:31 | 4 | 8 | 67 | 20.9 | 496 | 3 | 48.7 |
| Connor McDavid | EDM | C | 24 | 10 | 23 | 33 | -5 | 10 | 23:20 | 3 | 10 | 72 | 13.9 | 545 | 0 | 47.8 |
| Connor Bedard | CHI | C | 22 | 13 | 18 | 31 | 9 | 22 | 21:07 | 4 | 6 | 72 | 18.1 | 514 | 2 | 50.2 |
| Jack Eichel | VGK | C | 22 | 10 | 20 | 30 | 4 | 2 | 21:02 | 0 | 12 | 91 | 11 | 511 | 2 | 49.4 |
| William Nylander | TOR | RW | 19 | 10 | 19 | 29 | 5 | 12 | 20:16 | 2 | 3 | 44 | 22.7 | 459 | 1 | 38.9 |
| David Pastrnak | BOS | RW | 24 | 11 | 18 | 29 | -7 | 14 | 20:09 | 5 | 8 | 85 | 12.9 | 496 | 2 | 100 |
| Cale Makar | COL | D | 22 | 9 | 20 | 29 | 22 | 10 | 25:35:00 | 0 | 7 | 62 | 14.5 | 591 | 3 | 0 |
| Leo Carlsson | ANA | C | 22 | 11 | 18 | 29 | 11 | 23 | 19:37 | 2 | 7 | 55 | 20 | 548 | 3 | 46.1 |
| Mark Scheifele | WPG | C | 21 | 11 | 17 | 28 | 6 | 16 | 20:18 | 3 | 3 | 49 | 22.4 | 467 | 2 | 51.3 |
| Leon Draisaitl | EDM | C | 24 | 14 | 14 | 28 | 6 | 6 | 22:29 | 7 | 5 | 59 | 23.7 | 561 | 1 | 56.9 |
| Mikko Rantanen | DAL | RW | 22 | 10 | 18 | 28 | -4 | 57 | 20:38 | 4 | 11 | 58 | 17.2 | 488 | 1 | 48.3 |
| Martin Necas | COL | C | 22 | 13 | 15 | 28 | 19 | 16 | 21:06 | 3 | 4 | 46 | 28.3 | 501 | 0 | 53.8 |
| Jason Robertson | DAL | LW | 22 | 13 | 15 | 28 | 9 | 2 | 20:21 | 4 | 7 | 96 | 13.5 | 482 | 1 | 0 |
| John Tavares | TOR | C | 22 | 12 | 15 | 27 | 3 | 6 | 18:35 | 2 | 2 | 66 | 18.2 | 473 | 1 | 60.9 |
| Kirill Kaprizov | MIN | LW | 23 | 13 | 14 | 27 | 1 | 6 | 22:10 | 6 | 4 | 78 | 16.7 | 479 | 1 | 0 |
| Cutter Gauthier | ANA | LW | 22 | 13 | 13 | 26 | 13 | 12 | 17:58 | 3 | 2 | 97 | 13.4 | 496 | 2 | 41.2 |
| Matt Boldy | MIN | LW | 23 | 13 | 12 | 25 | 3 | 12 | 21:03 | 5 | 6 | 75 | 17.3 | 478 | 2 | 39.4 |
| Brad Marchand | FLA | LW | 21 | 13 | 12 | 25 | -6 | 18 | 18:11 | 2 | 6 | 60 | 21.7 | 471 | 1 | 20 |
| Nikita Kucherov | TB | RW | 20 | 10 | 15 | 25 | 1 | 6 | 20:29 | 3 | 4 | 60 | 16.7 | 444 | 3 | 0 |
| Bo Horvat | NYI | C | 23 | 14 | 11 | 25 | 13 | 20 | 20:22 | 3 | 5 | 79 | 17.7 | 549 | 3 | 59.1 |
| Dylan Larkin | DET | C | 23 | 13 | 12 | 25 | 11 | 22 | 20:42 | 3 | 2 | 78 | 16.7 | 566 | 3 | 56.7 |
| Kyle Connor | MPG | LW | 21 | 11 | 14 | 25 | 5 | 6 | 20:34 | 1 | 5 | 76 | 14.5 | 480 | 1 | 0 |
| Troy Terry | ANA | RW | 22 | 7 | 18 | 25 | 14 | 4 | 18:54 | 0 | 6 | 53 | 13.2 | 527 | 1 | 66.7 |
| Alex DeBrincat | DET | RW | 23 | 11 | 14 | 25 | -2 | 4 | 18:00 | 6 | 3 | 88 | 12.5 | 488 | 2 | 40 |
| Evgeni Malkin | PIT | C | 21 | 6 | 18 | 24 | 4 | 14 | 17:41 | 2 | 8 | 52 | 11.5 | 429 | 0 | 45 |
| Lucas Raymond | DET | LW | 21 | 7 | 17 | 24 | 7 | 4 | 18:15 | 1 | 6 | 53 | 13.2 | 465 | 2 | 100 |
| Sidney Crosby | PIT | C | 21 | 13 | 10 | 23 | -3 | 24 | 19:09 | 6 | 2 | 46 | 28.3 | 464 | 1 | 53.5 |
| Tom Wilson | WSH | RW | 23 | 12 | 11 | 23 | 11 | 52 | 19:29 | 4 | 2 | 52 | 23.1 | 541 | 1 | 50 |
| Nick Suzuki | MTL | C | 21 | 5 | 18 | 23 | 11 | 4 | 20:27 | 3 | 6 | 44 | 11.4 | 466 | 0 | 52.3 |
| Morgan Geekie | BOS | C | 24 | 17 | 6 | 23 | -7 | 8 | 17:43 | 4 | 3 | 65 | 26.2 | 472 | 2 | 43 |
| Josh Morrissey | WPG | D | 21 | 5 | 17 | 22 | 7 | 6 | 24:32:00 | 1 | 5 | 37 | 13.5 | 604 | 0 | 0 |
| Jake Guentzel | TB | C | 22 | 12 | 10 | 22 | 4 | 6 | 20:44 | 3 | 3 | 64 | 18.8 | 512 | 2 | 53.8 |
| Nick Schmaltz | UTA | C | 23 | 10 | 12 | 22 | 0 | 4 | 19:29 | 3 | 3 | 58 | 17.2 | 536 | 2 | 38.3 |
| Brandon Hagel | TB | LW | 21 | 11 | 11 | 22 | 10 | 12 | 19:27 | 1 | 2 | 62 | 17.7 | 503 | 3 | 44.8 |
| Jesper Bratt | NJ | LW | 22 | 5 | 17 | 22 | 0 | 8 | 18:15 | 1 | 5 | 50 | 10 | 498 | 2 | 0 |
| Cole Caufield | MTL | RW | 21 | 13 | 9 | 22 | 9 | 8 | 18:28 | 1 | 5 | 59 | 22 | 440 | 3 | 40 |
| Kirill Marchenko | CBJ | RW | 22 | 8 | 14 | 22 | 8 | 8 | 18:57 | 1 | 6 | 65 | 12.3 | 471 | 2 | 0 |
| Matthew Knies | TOR | LW | 19 | 5 | 17 | 22 | 4 | 8 | 20:32 | 2 | 0 | 42 | 11.9 | 450 | 0 | 0 |
| Trevor Zegras | PHI | C | 21 | 7 | 14 | 21 | -1 | 20 | 18:29 | 2 | 6 | 50 | 14 | 454 | 0 | 37.8 |
| Tim Stutzle | OTT | C | 22 | 11 | 10 | 21 | 7 | 8 | 20:07 | 2 | 4 | 59 | 18.6 | 571 | 3 | 60.4 |
| Wyatt Johnston | DAL | C | 22 | 11 | 10 | 21 | -3 | 6 | 21:04 | 8 | 5 | 62 | 17.7 | 533 | 2 | 51 |
| Logan Cooley | UTA | C | 23 | 13 | 8 | 21 | 5 | 20 | 18:33 | 3 | 1 | 48 | 27.1 | 510 | 1 | 40.3 |
| Will Smith | SJ | C | 23 | 7 | 14 | 21 | 5 | 8 | 18:06 | 1 | 5 | 53 | 13.2 | 458 | 2 | 17.4 |
| Alex Ovechkin | WSH | LW | 23 | 10 | 11 | 21 | 7 | 4 | 17:51 | 1 | 3 | 54 | 18.5 | 468 | 3 | 100 |
| John Carlson | WSH | D | 22 | 5 | 16 | 21 | 8 | 6 | 23:10 | 0 | 5 | 50 | 10 | 524 | 0 | 0 |
| Sam Reinhart | FLA | C | 22 | 13 | 8 | 21 | -8 | 2 | 21:02 | 4 | 4 | 63 | 20.6 | 526 | 5 | 32.4 |
| Alex Tuch | BUG | RW | 22 | 8 | 13 | 21 | 3 | 33 | 18:30 | 1 | 1 | 50 | 16 | 570 | 0 | 44.4 |
| Mitch Marner | VGK | RW | 22 | 4 | 17 | 21 | 6 | 4 | 20:44 | 1 | 4 | 39 | 10.3 | 489 | 0 | 52 |
| Zach Werenski | CBJ | D | 23 | 7 | 14 | 21 | 8 | 0 | 26:26:00 | 1 | 5 | 89 | 7.9 | 609 | 0 | 0 |